Introduction
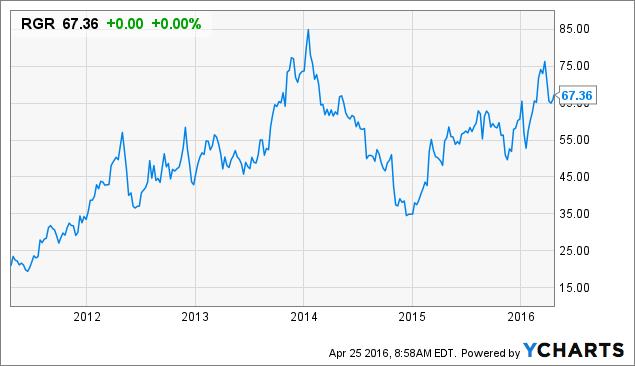
Excluding a brief period in 2014 to 2015, I have been heavily invested in Sturm, Ruger & Co. (NYSE:NYSE:RGR) in most client portfolios since early 2011. Last July (2015), I wrote an article on the company where I predicted the stock would breach $80 in 2016 and make a new all-time high. At the time, Ruger was trading around $57. It has since moved higher and touched $76 in March 2016, just off its all-time high around $80. The following chart shows the price action of RGR over the last five years:
RGR data by YCharts
The stock has recently pulled back and given investors what I view as a good entry point.
Ruger’s earnings going forward will primarily be driven by two factors: the U.S. secular demand trend for firearms and how the company is positioned in the industry (e.g., products and market share). Underneath all the media driven hype over firearms, many investors are simply not aware of the exceptional performance of Ruger as a company. We will start with a detailed look at the company’s market share expansion, examine the secular demand trend for firearms, and then compile earnings estimates on Ruger based upon the combined analysis.
Before I dig into this article, I also want to highlight my primary data source. The U.S. Bureau of Alcohol, Tobacco, Firearms and Explosives (ATF) publishes data on the number of firearms manufactured in the U.S. and also those imported from other countries. To gauge the level of U.S. firearms demand I analyze the number of firearms produced globally for the U.S. market and strip out U.S. exports. I realize that I am using supply data (firearms manufactured) to gauge demand, but I am comfortable with this because this supply has been readily consumed. I will expand on this more in the report.
Industry and Competitive Backdrop
Publicly traded firearms manufacturers are a rarity in the global equity landscape. With the exception of Forjas Taurus S.A. in Brazil, an unprofitable conglomerate that owns Taurus firearms, they are exclusive to the United States and only two companies there have it as their primary business. These two are Smith & Wesson Holding Corporation (NASDAQ:SWHC) and Ruger. Vista Outdoor (NYSE:VSTO) does earn almost 10% of its revenue from its Savage rifle business, but the rest of its exposure to the firearms industry is exclusive to ammunition and accessories. Smith & Wesson has announced its strategic intention to began to diversify into firearms accessories and outdoor equipment so it may end up looking more like Vista Outdoor several years from now. For now, it should be considered a pure play, though, because it still derives over 90% of its revenue from firearms. Eventually, Ruger may be the only pure play on firearms in the world. The vast majority of firearms sales for both Smith & Wesson and Ruger go to the general U.S. consumer market, which includes state and local law enforcement agencies and federal government agencies. The U.S. military generally sources its firearms from private U.S. and European manufacturers.
With broad product lines, extensive capital resources as public companies, and motivated management teams, Ruger and Smith & Wesson are dominant industry players. Throughout the remainder of this report, I will often compare the two for further insight into Ruger’s underlying performance and competitive advantages/disadvantages.
Ruger manufacturers and sells three types of firearms: rifles, revolvers, and pistols. From time to time, it manufactures shotguns, but is generally not involved due to management’s perception of less opportunity there. (Pistols are the modern version of handguns that use clips to feed the ammunition, whereas revolvers are the classic type you would see in a Western movie with the spinning cylinder typically holding 6 shells. Revolvers remain highly regarded for self-defense due to their reliability and simplicity of operation.) The remainder of this report, including all charts and other statistics, will focus exclusively on rifles, revolvers, and pistols (shotguns are excluded). The following table shows the primary competitors in each of these product lines, further broken down by specific type (most of this data was taken from the most recent Smith & Wesson investor presentation; note: rimfire refers to smaller caliber arms, such as the popular .22, that are generally used for target shooting and small game hunting):
| Type of Firearm | Primary Competitors (no particular order) |
|---|---|
| Semi Automatic Pistols |
Glock, Beretta, Ruger, Smith & Wesson, Kimber, H&K, Sig Sauer, Springfield, Taurus |
| Rimfire Semi Automatic Pistols |
Ruger, Smith & Wesson, Sig Sauer, Walther |
| Revolvers |
Ruger, Smith & Wesson, Taurus |
|
Centerfire Modern Sporting Rifles (MSR) |
Smith & Wesson, Colt, Daniel Defense, DPMS/Bushmaster, Rock River, Ruger, Sig Sauer |
| Rimfire MSR |
Smith & Wesson, Colt, Mossberg, Ruger, Sig Sauer |
| Bolt Action Rifles (Centerfire and Rimfire) |
Ruger, Browning, Marlin, Remington, Winchester, Savage Arms, Weatherby, Thompson Center (owned by Smith & Wesson) |
| Black Powder Rifles | Thompson Center, CVA, Traditions |
Click to enlarge
The bolt action rifle and semi automatic pistol markets are the most fragmented. The semi automatic pistol market is where both companies face the most foreign based competition from Glock (Austrian), Beretta (Italian), Sig Sauer (German), H&K (German), Walther (German), and Taurus (Brazilian). Most, if not all, of these foreign competitors now have U.S. manufacturing operations. A few years ago, Kalashnikov (Russian) was ramping up to import MSR-type rifles, modeled after its legendary AK-47, into the U.S., but that seems to have fizzled out for now, though. However, under the right circumstances, it could become a formidable competitor within the Centerfire MSR segment.
Ruger and Smith & Wesson have comparative product lines focused on rifles, revolvers, and pistols (neither is focused on shotguns). Smith & Wesson owns Thompson Center, which is where it derives its regular rifle (non-MSR) and black powder rifle sales. There are two primary differences between each company’s product line that represent potential advantages/disadvantages for each, as follows:
1. Thompson Center dominates the inline muzzleloader segment of the black powder market. In its 2009 10-K filing, it estimated its black powder market share to be 37%. I personally own one and would not consider the other brands if I was to buy another. One of the main reasons is their innovative breech plug (shown below), which makes for easy removal and cleaning (black powder is messy).
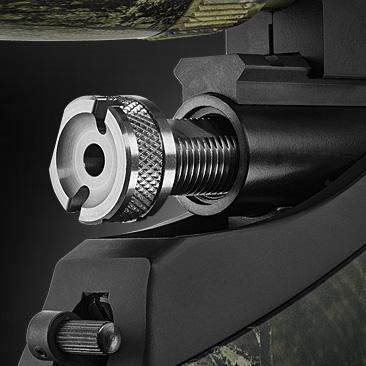
source: Thompson Center Arms
Ruger is not involved in the black powder market. A potential entry would represent a new growth avenue; however, this is a relatively small part of the overall firearms market (about 3%). In recent years, Ruger has sent out an annual survey to customers which asked what types of new products they would like to see. I received the survey and I recall muzzleloaders as being an option we could vote for. Inline muzzleloaders are more modern versions of classic black powder rifles. Many states have created special hunting seasons for them, which has led to increased popularity amongst hunters. Hunters can legally use scopes with inline muzzleloaders to hunt big game, which effectively makes them viable out to a couple of hundred yards.
2. Ruger has a successful bolt action rimfire rifle line, where as Smith & Wesson (Thompson Center) does not sell bolt action rimfire rifles. This is the most notable difference. Ruger also sells an extensive line of licensed, Ruger branded airguns manufactured by UMAREX. Smith & Wesson also does not sell airguns. This provides Ruger with a subtle advantage that is easily overlooked. Airguns and rimfire rifles (e.g., popular .22 caliber) are the guns of youth, typically being the first type that many will shoot or own. This gives Ruger the first-mover advantage against Smith & Wesson when it comes to brand recognition.
These nuances in product lines are relevant, because to the extent that either company is more exposed to the traditional shooting and hunting demographic, their sales will likely be less volatile. Keep this in mind as we explore the market share dynamics.
Ruger’s Market Share
The current Ruger success story really began in 2007, shortly after current CEO, Michael Fifer, was hired. Prior to his leadership, Ruger’s market share was stagnant at best. Fifer added new engineering teams that spearheaded the launch of many innovative new products that have consistently driven Ruger’s share of the handgun and rifle markets higher. Furthermore, Ruger won both the handgun and the rifle of the year awards from the Shooting Industry Academy of Excellence four years in a row (2008 to 2011). A few years ago Fifer mentioned on a quarterly earnings call that its competitors stopped showing up.
There are a couple of ways to estimate Ruger’s market share. I like to compare the “sell-through” number (units sold through distributors to retailers) the company estimates and its orders shipped to my estimated natural demand for firearms (more on natural demand later). The following table reveals the steady climb of Ruger’s market share under Fifer:
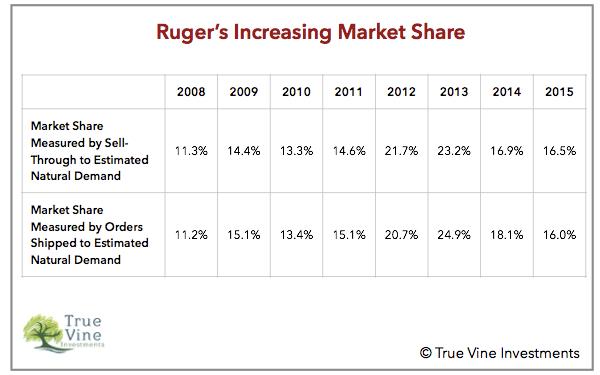
Based on these numbers, Ruger’s market share approximately doubled from 2008 to 2013. It dipped in 2014 and 2015, but I think some of this is attributable to the fact that the company did not discount its products substantially during the coinciding cyclical downturn. At present, I think an estimate of 18% for Ruger’s market share is a good number to use for projecting the demand for its products in 2016.
To determine whether Ruger can increase its overall market share, it is helpful to estimate its market share in each specific product line. This is, however, more difficult. Ruger does not disclose its estimated sell through or orders shipped for each product line. The ATF also does not provide the breakdown of what percentage of handgun imports are pistols versus revolvers. However, we can generate a reasonable estimate of each by assuming the import breakdown is similar to the production breakdown of U.S. manufacturers. For example, 83% of the handguns manufactured in the U.S. in 2014 for the U.S. market were pistols. We can then compare the number of each line that Ruger has manufactured to an estimated total of each line manufactured globally for the U.S. market. This is what the data looks like:
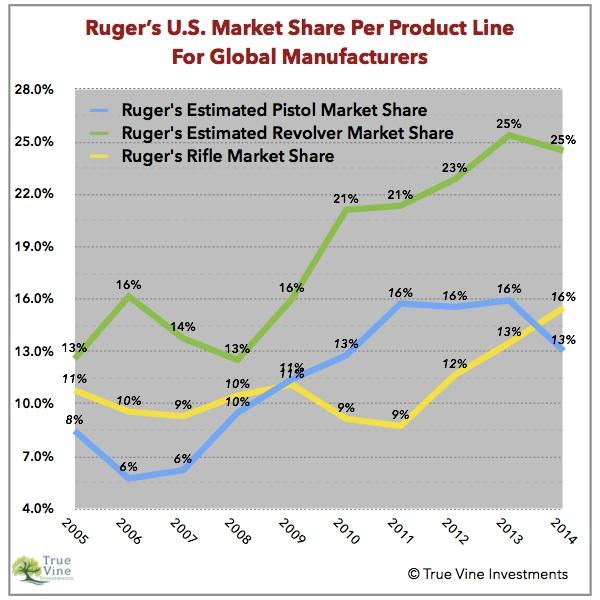
This chart is probably the most valuable piece of information in this article. I wouldn’t put too much stock in any single data point, given the estimation method, but it is clear that Ruger has been driving its market share range higher across the board ever since Fifer took over in 2007. Let us now take a look at how Ruger’s market share in each product line versus Smith & Wesson. I will highlight some key points regarding each.
Rifles
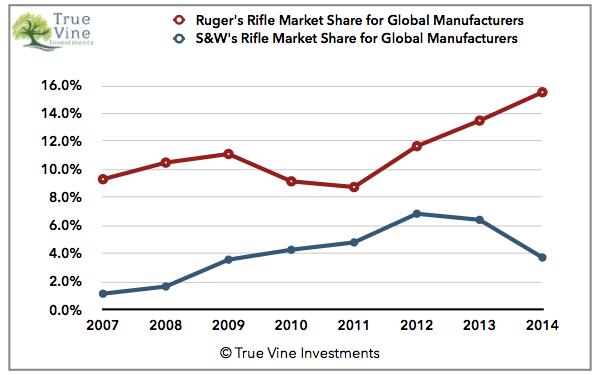
A 7-year cycle ago, Smith & Wesson was a very minor play in the rifles market. In 2007, it only manufactured 24,585 rifles, but ramped up considerably thereafter. It almost tripled its production for the U.S. market in 2009, making 108,879 rifles that year compared to only 37,025 the year before. The majority of this increase was attributable to aggressive expansion into the MSR (or “tactical”) rifle segment, where the company is now a leader. However, this less traditional, tactical segment is more influenced by political trends, and thus, more volatile. These rifles have a higher price tag, are generally purchased by shooting enthusiasts, and are not used as much for hunting. The volatility can be seen in the above chart as Smith & Wesson’s rifle market share plummeted during the industry downturn of 2014. In its 2015 10-K, the company estimated its overall rifle market share to be 6%. This confirms the accuracy of the above data and points to a stabilization in the company’s rifle share. Overall, Smith & Wesson has little exposure to the more traditional rimfire and centerfire rifle market.
Ruger’s gains in rifle share have been driven by the successful launch of the Ruger American Rifle and 10/22 series. These rifles are generally purchased by hunters and families that enjoy the outdoors. I live in the State of Pennsylvania, which is one of three largest U.S. states for firearms sales (along with Texas and Florida). I receive a flyer from the largest gun shop in the state, and over the past few years, the Ruger American and/or 10/22 have been typically featured prominently on the front page. It seems to me that Ruger has done an excellent job marketing and distributing these new product lines. The 56% gain in its rifle market share from 2011 to 2014 confirms this. Ruger has been more of a late comer to the MSR rifle segment, but its recent product launches have been strong performers. Ruger is only producing them at a rate that they view as sustainable over the longer term. Overall, Ruger’s rifle share is less volatile than Smith & Wesson’s, because it has less overall exposure to the MSR segment.
Pistols
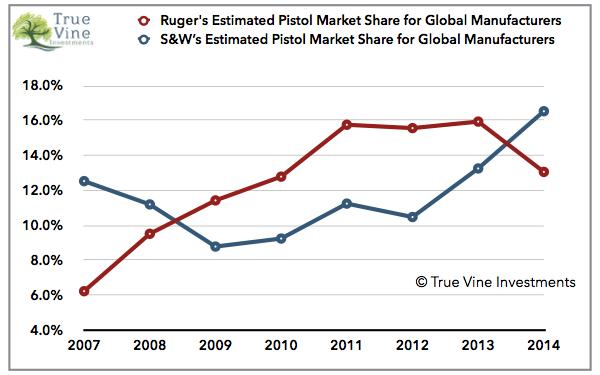
The pistol market is the most competitive globally with several popular European brands constantly, making it challenging for U.S. manufacturers. Nonetheless, Ruger and Smith & Wesson have been driving their share higher. Ruger’s consistent 16% share from 2011 to 2013 was 60% higher from when Fifer took over.
Revolvers
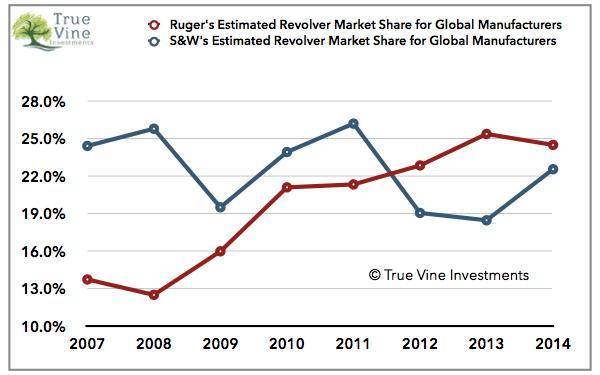
This chart tells an important story about the success of Ruger. A decade ago, Smith & Wesson only produced revolvers and have been well known for them ever since Clint Eastwood carried one as Dirty Harry. Nevertheless, under Fifer’s leadership, Ruger has overtaken it (slightly), almost doubling its market share from 2007 to 2014.
In 2010, when I personally was less knowledgeable on firearms, and before I ever even looked at a firearms stock, I was helping a family member purchase a small revolver for concealed carry/self-defense. (Small, double action revolvers are ideal for concealed carry. It is essentially impossible for them to jam and all the user has to do is point and pull the trigger.) She didn’t want to spend a lot and wanted something that was simple to operate. The choice came down to similar offerings between Smith & Wesson and Ruger. She ended up choosing the Ruger LCR. With the number of women purchasing firearms skyrocketing (more on that later), the revolver data above points to the fact that Ruger has possibly been more successful at luring new consumer demographics.
Market Share Expansion
It is important to consider whether or not Ruger can continue to grow its market share. If overall firearms demand only remains constant, Ruger could still grow earnings if it was to increase its overall market share into the 20% to 25% range. Consider the following chart:
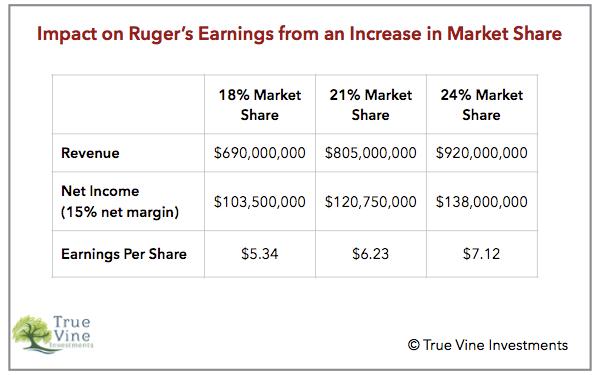
I think the potential pathway for Ruger to garner and maintain an overall market share in the 20% to 25% range lies primarily with a continual expansion of its share of the rifles market. This would be in tandem with a bit more share of the revolver market and the company just holding its own in pistols. Here is the formula I see:
- Rifles – 20%
- Revolvers – 30%
- Pistols – 17%
When I run this market share breakdown against my 2014 estimated natural demand numbers (more on that later), I come out with a hypothetical overall market share of about 21.5%. In other words, if Ruger were to meet or exceed each of these specific product line market share targets, its overall market share would likely be 21.5%+. At this point, I think Ruger is good for 20% overall market share within the next couple years, but anything beyond 23% is probably a stretch. During the most recent quarterly conference call, Fifer did mention that they have a long list of new products in the pipeline. Furthermore, after adding a new factory and engineering teams in North Carolina a few years ago, it has plenty of potential new production capacity to do so.
To gauge Ruger’s future market share potential, investors should focus on new product launches. In recent years, these have accounted for about 20% of Ruger’s sales (21% in 2015 and 16% in 2014). This is the most likely “what could go wrong” area, but the overwhelming success of recent launches and the depth of the the current pipeline leave me unconcerned.
Dispelling Myths
The market’s myopic view on firearms stocks – bullish and bearish – could best be summarized with the following points:
- Firearms demand exploded after President Obama was elected due to his attacks on the 2nd Amendment rights of Americans.
- Firearms demand is politically driven and spikes after mass shootings.
- The potential election of Hilary Clinton as President is further driving demand. The current rate of growth in firearms demand is not sustainable.
These points represent the common viewpoints thrown around by the media and traders. The bulls see the current political environment as supportive and the bears see it as a bubble. The latter view has been confirmed by a continual high level of short interest in Ruger.
These views have obvious elements of truth in them, but it is my view that they are something of a sideshow, exacerbated by an urban-based, U.S. media that generally knows very little about the demographic of firearms demand. There are several important underlying trends that are really driving sustainable firearms demand.
Exceptional Firearms Demand Predates Obama Administration
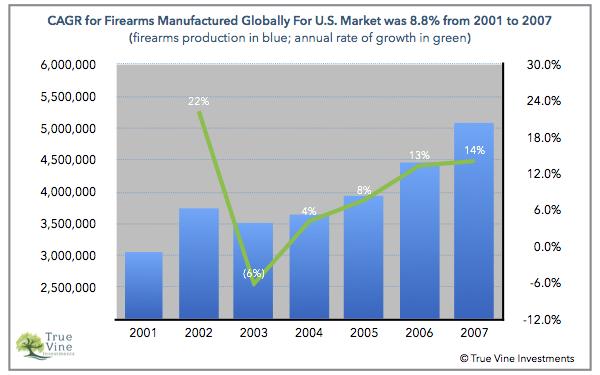
A lot of discussion on the firearms market assumes that demand really took off after President Obama became the U.S. President in January of 2009. However, this is not what the ATF data tells us. The following chart reveals that the compounded annual growth rate (“CAGR”) in firearms manufactured globally for the U.S. market was almost 9% from 2001 to 2007, well before the 2008 election year.
The following chart shows the same data over the last two 7-year market cycles (2001 to 2007 and 2008 to 2014):
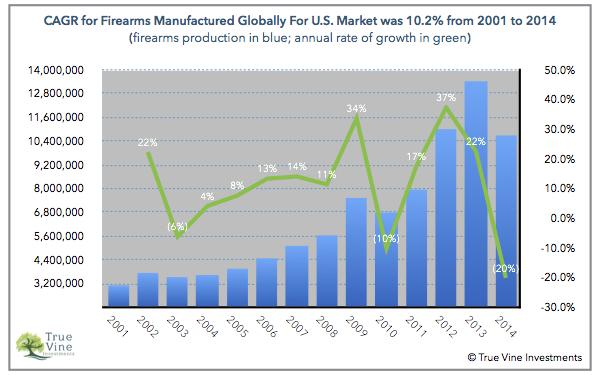
The CAGR for the 2008 to 2014 period, when the Obama Presidency was in focus, was 11.3%, only 2.5% higher than the period beforehand (2001 to 2007). This yields a CAGR of 10.2% for the entire 14-year period. I think this data helps confirm my view that something else has been going on to fuel a secular trend higher in firearms demand.
I start measuring the current secular growth rate in firearms demand in 2001. Why go so far back and why this date? To me, 2001 marks a period of time about when the rise of digital media truly began. It was around this time that many people, myself included, purchased their first computer.
It is my view that the rise of digital media has been a hidden factor supporting the secular trend of increased firearms demand. Here are two important ways that I think it has had an impact:
- Firearms related deaths in the U.S. have been declining every year since 1993, but Americans do not believe it. Why do they not believe it? The greater consumption of news has amplified the anxiety and fear people have over terrorism and violent crime and led to a greater desire for personal protection. In other words, the amount of sin in the world has not increased, but the perception of it has. When someone went to get the mail twenty years ago, they walked out their sidewalk, took it out of their mailbox, and came in the house. Now, the same person logs on to their computer – or simply just looks at their phone – to retrieve email and gets bombarded with all sorts hyper-sensitized news stories. Furthermore, they go to this digital mailbox ten times a day.
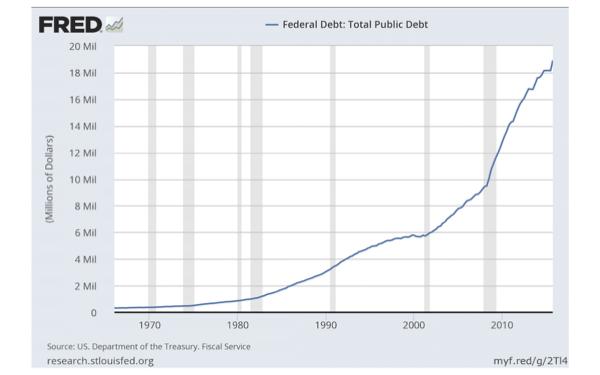
- Digital media has enabled the rise of alternative, conservative media in the U.S. that has educated the population on the importance of the 2nd Amendment. This has enlightened many to the benefits of personal protection and emboldened them to purchase firearms and learn how to use them. The rise of alternative media has also shone more light on the negative aspects of the U.S. government, further reinforcing my first point. To some extent, 2001 may also mark a period of time when confidence in government began to decline. This coincides with the beginning of a significant spike higher in U.S. Federal Debt (see chart below) and the rise in the price of gold, which is viewed by many as a hedge against government. There is a segment of the population who knows history and understands that this will ultimately lead to instability. They want to be prepared for it.
This section is not meant to be an exhaustive consideration of these factors and most readers will be more knowledgeable on the various facets than myself. The point I want to drive home is that after considering these points, it is important to ask, “Is anything happening to alter this course?” No, not even close. Terrorism, draining public funds (less police), the national debt, and the anti-government mood are all accelerating. Furthermore, as I pointed out in my last Ruger article, there is a looming public pension crisis coming in the United States that will likely be volatile for some of the major U.S. states and cities.
Favorable Demographic Trends
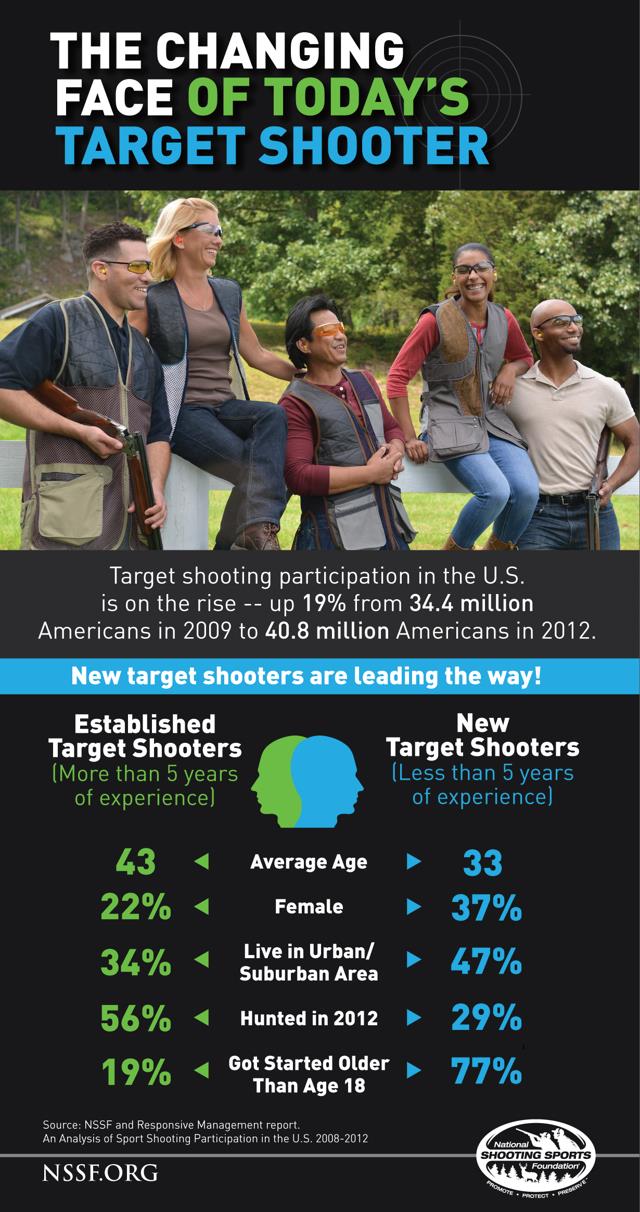
Regardless of the impact of digital media, the demographic trends for firearms demand have been favorable. Increased numbers of women and members of the younger millennial generation have been purchasing firearms. (The millennial generation is roughly defined as those Americans born between 1982 and 2004. Comprising approximately 95 million, they are the largest generation in American History.) Consider the following notable statistics from the National Shooting Sports Foundation (NSSF), most of which came from this survey and research report:
- From 2009 to 2012, the number of new target shooters in America increased by 19%, from 34.4 million to 40.8 million.
- Retailers reported that 25% of firearms purchases within the last five years went to first-time buyers.
- 37% of new target shooters are female compared to 22% of established shooters.
- 20% of all target shooters began within the last five years.
- 66% of new shooters fall into the 18-to-34 year old category compared to 31% in the same age category for established shooters.
Some of these points and more are emphasized in the following infographic put out by the NSSF:
Increased sales to first-time buyers and the younger generation and an increase in target shooters is especially important, because these individuals are likely to continue to keep buying in the years to come. Additionally, more women are participating in hunting. (My former neighbor’s teenage daughter has harvested more deer than me over the last couple of years.) I would encourage readers to take a look at the comment sections on other Seeking Alpha articles on Ruger or Smith & Wesson, such as this one. There is a host of anecdotal evidence that confirms this data presented by the NSSF.
A couple of years ago I was meeting with a new millennial-age client and I mentioned investing in Ruger. He said to me, “Ruger… I love Ruger!” He had already purchased several of its firearms.
I once read an opinion piece in the Financial Times by Gillian Tett that gave me a good laugh. Referring to us Americans, she said something like, why would anyone need more than 5 guns? The answer: the same reason why Gillian probably needs more than 5 pairs of shoes.
Consider a hunter in the state of Pennsylvania who hunts in every season. He would need (or possibly want) the following types of firearms:
- Inline muzzleloader for the October doe season.
- Shotgun for small game and possibly a different shotgun for turkeys.
- Rimfire rifle for small game.
- More powerful rimfire rifle for turkeys (e.g., heavy barrell .22 magnum).
- Centerfire rifle for deer (and possibly a more powerful centerfire rifle if he or she puts in for the elk lottery).
- Flintlock muzzleloader for the January season.
Here is 6 to 8 possible long guns just for hunting. This doesn’t even consider a possible spouse or children who may also hunt. Nor does this even get into the realm of firearms for concealed carry, home protection, or target shooting.
Gauging The Natural Demand For Firearms
Using the ATF data, I have developed what I call the natural rate of growth for firearms demand. The idea is to determine approximately what the real, underlying, long-term secular growth trend is, aside from temporary spikes in demand due to political issues that bring forward future demand.
There are two ways I like to estimate what this growth rate has been.
- I generally use a 7-year cyclical approach to make growth rate calculations. To do this I take the average of 7 years (e.g., 2001 to 2008) and compare it to the average of 7 years calculated one year later (e.g., 2002 to 2009). The average change of 7 of these, 7-year periods (e.g., 2001 to 2008, 2002 to 2009, 2003 to 2010, and so on) produces a nice, smoothed rate of growth. Using this technique from 2001 to 2014 yields a growth rate of 12.7%.
- I also like to simply take the average annual rate of change over a long period of time. This was 11.3% for the 2002 to 2014 period.
At present, I use 10% for this natural rate of growth to be a tad bit conservative. With this number, we can project what the intrinsic demand for firearms will be in the coming years. We can also use this to gauge when current demand is exceeding the true natural demand. With an estimate of Ruger’s market share, we can easily project the company’s future revenue and earnings.
Here is what current and future year firearms demand in the U.S. is shaping up to be based on a projected rate of growth of 10%:
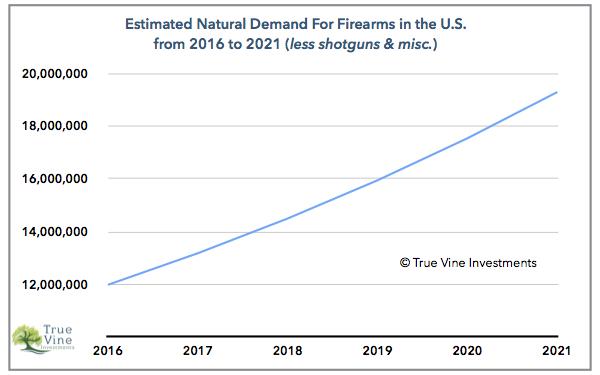
I would be more concerned about this growth trend not ultimately playing out if other investors were actually talking about it. However, I have never seen anyone present any data like this. By and large, market participants remain focused on the same myopic talking points that I outlined in the beginning. I expect a continuation of the current demand catalysts and the onset of future catalysts that I previously touched on (e.g., public pension crisis) to transpire in this time window to further drive demand higher.
Earnings Estimates
Now that I have derived estimates on the natural demand for firearms in the U.S. and estimated Ruger’s current market share, we can combine the two to derive earnings estimates. The following table brings the key variables together:
| 2016 | 2017 | 2018 | Notes | |
|---|---|---|---|---|
| Estimate of Natural Demand for Ruger Firearms (millions) | 2.16 | 2.37 | 2.61 | based on 18% market share |
| Ruger Units Sold (millions) | 2.1 | 2.3 | 2.6 | rounded down (more conservative) |
| Average Unit Price | $320 | $320 | $325 | |
| Revenue ($ millions) | $692 | $756 | $865 | added $20 for misc. accessory sales |
| Operating Income ($ millions) | $152 | $178 | $216 | |
| Operating Margin | 22% | 23.5% | 25% | margins revert back to 2013 peak |
| Net Income ($ millions) | $99 | $115.5 | $140.6 | assume 35% tax rate |
| Earnings Per Share (“EPS”) | $5.11 | $5.96 | $7.26 | 19,374,543 shares |
| Dividends Per Share | $2.04 | $2.38 | $2.9 | Ruger pays out 40% of income |
| Implied Yield at $66 Per Share | 3.1% | 3.6% | 4.4% |
Click to enlarge
At a constant market share of 18%, I am projecting that Ruger will increase its EPS by 42% from 2016 to 2018. As previously referred to, earnings growth could be substantially higher if it can grow its overall market share into the 20% to 25% range.
Ruger has an excellent policy of only repurchasing shares when their stock is trading at very low historical valuation levels (e.g., P/E below 10) so I do not anticipate share repurchases anytime soon. Management likes to pay special dividends. In 2012, the company paid out $111.5 million in dividends, most of which came from a special dividend late that year. This equated to a 12.5% yield at the 2012 year end price. CEO Fifer has repeatedly mentioned on quarterly conference calls that he would like to pay another special dividend soon. Ruger’s cash balances are piling up so I expect one later this year. At the end of 2015, they had $69 million in cash on the balance sheet (working capital was a positive $107 million). I estimate its free cash flow will be about $115 million this year. A $125 million special dividend on top of its regular dividend would be $8.49 per share, which equates to a total yield of almost 13%. The announcement of a special dividend in the near term would help fuel the next major move higher in this stock. This will be tough for the shorts, who have to pay dividends, to swallow. According to Interactive Brokers, 11% of Ruger’s shares outstanding are short with 5 days to cover.
Strategic Conclusion
Applying my 7-year cyclical approach to Ruger’s past earnings and free cash flow (back to 2006 right before Fifer took over) and my estimated future earnings and free cash flow out to 2021, I rank Ruger’s annual earnings growth potential at 20%. Coupled with an all out bullish view on the industry, True Vine Investments proprietary stock evaluation model yields a 12-month forward multiple of 22. In other words, my target price is 22 times my estimate of the average of the company’s EPS and free cash flow per share (FCFPS) over the next 12 months. This equates to a target price of $125. At the current price of around $66, Ruger presents investors with substantial upside potential.
Promoting Quality Discussion
In order to promote quality discussion about the topics I address in my Seeking Alpha articles, I have decided to give away a free copy of my book, The Truth On Investing: From The Darkness Of The Crowd To The Light, to the individual who provides what I think is the most thoughtful comment on the article. This can also be a quality view that is opposed to my thesis. I will pick this person about a month after the article is published to allow time for comments. If there are no exceptional comments, then no book will be given out. Thanks for reading and hopefully contributing to the discussion.
Important Regulatory Disclosure
I am a Registered Investment Advisor in the State of Pennsylvania (U.S.A.). I screen electronic communications from prospective clients in other states to ensure that I do not communicate directly with any prospect in another state where I have not met the registration requirements or do not have an applicable exemption.
Any investment advice or recommendations involving securities referenced in this article is general in nature and geared towards a readership of sophisticated investors. This article does not involve an attempt to effect transactions in a specific security nor constitute specific investment advice to any particular individual. It does not take into the account the specific financial situation, investment objectives, or particular needs of any specific person who may read this article. Individual investors are encouraged to independently evaluate specific investments and consult a licensed professional before making any investment decisions.
Positive comments made regarding this article should not be construed by readers to be an endorsement of my abilities to act as an investment adviser.
Did you miss our previous article...
https://galleryforgreatguns.com/manufacturer-news/fbi-join-brandon-police-in-special-investigation-discoverwestmancom